Research
What Used Car Prices Taught Us About Supply Chains
A chip shortage cut new car output, buyers moved to used, and used supply cannot be manufactured. How prices rose 54 percent, and why the unwind took four times as long.
By the Euphoria team · 2026-07-22 · 8 min read
Key points
- The used vehicle price index rose 45.2 percent over the twelve months to June 2021, the largest increase in a series that begins in 1953.
- Used car supply is the stock of cars that already exist, so it cannot expand in the short run, which forces the whole adjustment into the price.
- New vehicle sales bottomed at a 14.2 million annual rate in 2022, not in 2020, because the chip shortage bit hardest two years after the pandemic began.
- The spike took about two years and the unwind is still incomplete after four, partly because roughly three million vehicles were never built and never came back.
The worst year was 2022
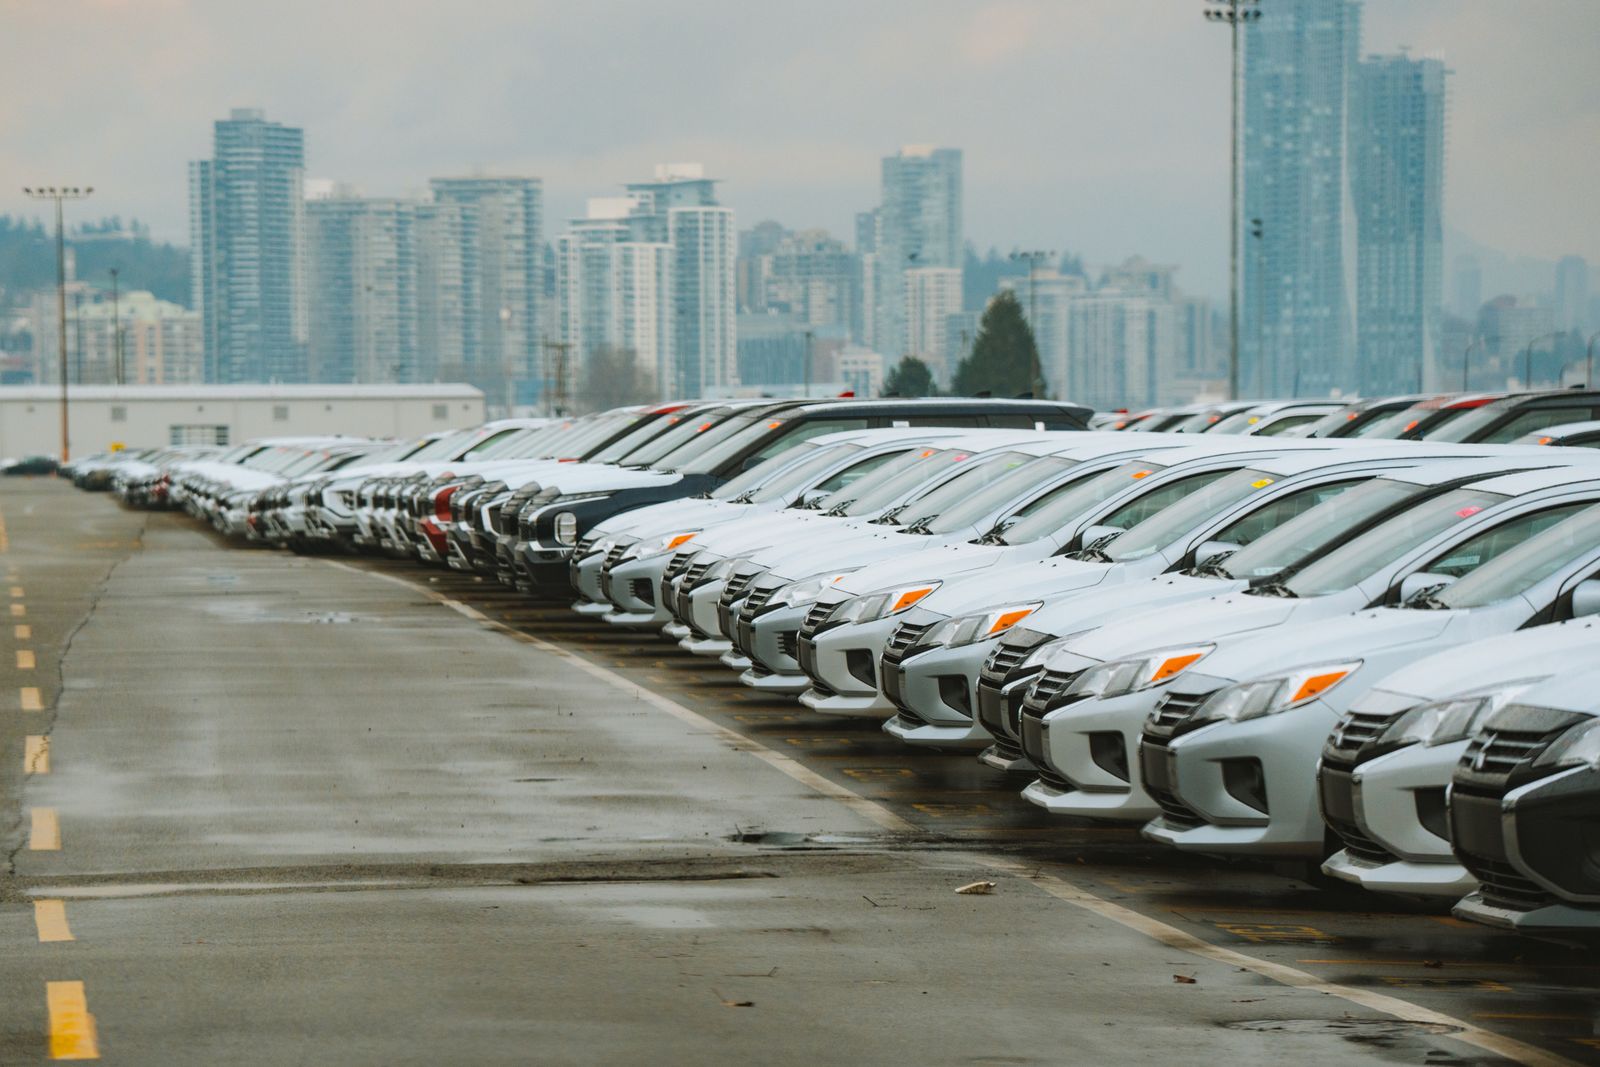
Ask when the car market broke and most people will say 2020. The data says otherwise. Americans bought new vehicles at an annual rate of 14.2 million in 2022, the weakest full year of the whole episode, worse than 2020's 14.9 million and well below the 17.5 million of 2019.
That gap matters, because 2020 and 2022 were broken in opposite directions. In April 2020 the sales rate fell to 8.9 million because nobody was allowed to go shopping. By April 2021 it was back to 18.6 million, higher than any pre-pandemic year, because everybody wanted a car at once. Then in September 2021 it collapsed again to 12.7 million, and this time the dealerships were open and the customers were standing there. There were simply no cars to sell them.
What happened in between is the cleanest demonstration of supply and demand that any economics teacher has ever been handed.
- 45.2% the rise in the used vehicle price index over the 12 months to June 2021, the largest in a series that starts in 1953
- 54% how far that index climbed from February 2020 to its February 2022 peak
- 14.2M new vehicles sold in 2022 at an annual rate, against 17.5 million in 2019
A car is 30,000 parts and it needs all of them
When vehicle plants shut down in the spring of 2020, carmakers did the sensible thing and canceled their semiconductor orders. Chip factories, which run best at full capacity, sold that capacity to the people who were suddenly buying enormous quantities of laptops, monitors and games consoles.
When car demand came back within months, the carmakers went to rebook capacity and found the queue full. The chips they needed were not exotic. Many were simple, old-design controllers costing a couple of dollars, the kind that run a window motor or a seat sensor. But a car will not ship without them, and you cannot substitute a different chip into a validated automotive design in a hurry. Building the capacity to make more takes years and billions of dollars.
So the binding constraint on a forty-thousand-dollar product became a part worth less than a sandwich. Factories built vehicles and parked them unfinished. Dealer lots emptied.
Why the used market took the hit
Here is the part that makes used cars the perfect teaching example. New and used vehicles are close substitutes: if you cannot buy a new one, a two-year-old one will do. So new car scarcity pushed a wave of buyers into the used market.
The used market could not respond. New car supply is a factory, and a factory can eventually run extra shifts. Used car supply is the stock of cars that already exist, and nobody can manufacture a three-year-old vehicle. In the short run that supply is close to inelastic, which means the quantity available barely changes no matter what the price does. When demand rises against a supply that cannot move, the entire adjustment has to happen in the price. There is nowhere else for it to go.
| Period | Used cars and trucks | New vehicles |
|---|---|---|
| 2018 | 138.4 | 146.3 |
| 2019 | 139.8 | 146.8 |
| 2020 | 144.3 | 147.6 |
| 2021 | 182.5 | 156.2 |
| 2022 | 205.9 | 172.5 |
| 2023 | 191.2 | 178.9 |
| 2024 | 179.9 | 177.9 |
| 2025 | 185.0 | 178.5 |
| 2026 | 180.3 | 179.1 |
Both series are index points on the same 1982 to 1984 base, annual averages of seasonally adjusted monthly readings. 2026 covers January to August. Used prices retraced most of the spike, new prices retraced none of it.
The two lines are the same measurement on the same scale, which is what makes the contrast readable. The used vehicle index rose 54 percent from February 2020 to its peak in February 2022. New vehicle prices rose too, by about 21 percent to their own peak, because carmakers stopped discounting and shifted production toward expensive trims. But new prices were anchored by a list price and a manufacturer's reputation. Used prices were set at auction, every day, by whoever showed up.
Wholesale prices moved first and hardest, because that is where dealers buy. Cox Automotive's Manheim index of wholesale vehicle values hit a record 236.2 in December 2021, up 46.6 percent in a year. Retail followed a month or two behind, which is the normal lag between what a dealer pays and what a dealer charges.
The spike was fast and the unwind was not
Prices went up violently and came down gently. That asymmetry is not a quirk, and it is visible in the twelve-month rate of change.
| Period | Change over twelve months |
|---|---|
| June 2021 | 45.2% |
| Jan 2022 | 40.5% |
| June 2022 | 7.1% |
| Jan 2023 | -11.6% |
| June 2024 | -9.9% |
| June 2026 | -1.8% |
The rise came in one violent burst and the fall has been a long shallow grind. No single month of decline came close to matching a single month of the spike.
Read that chart as a story rather than a set of bars. The used vehicle index was rising 45.2 percent a year in mid 2021 and still 40.5 percent in January 2022. Six months later the annual increase was 7.1 percent. Then came the decline, and the decline never got dramatic: about 12 percent down over the year to January 2023, about 10 percent over the year to June 2024, and a slow drift after that. Four years later the index still has not returned to where it started.
Three mechanisms explain the slow half.
- The cars that were never built were never going to exist. A shortfall of roughly three million vehicles in 2022 alone, measured against 2019's sales rate, is three million cars permanently missing from the fleet. Time cannot restore them.
- Nobody is forced to sell. If the price your car fetches drops, you can keep driving it. That withdrawal of supply at low prices puts a soft floor under the market that a perishable good, like a shipping container of strawberries, never gets.
- Fleet buyers had to rebuild. Rental companies sold large parts of their fleets in 2020 to survive the travel collapse, then had to buy them back in 2021 and 2022, bidding at the same auctions as the dealers. The market's biggest sellers briefly became its biggest buyers.
The echo nobody planned for
The interesting consequence arrived years later, and it is pure arithmetic.
A typical lease runs three years. Cars leased in a given year come back to the used market three years after that, in reliable, predictable volume, and they are the best used inventory there is: recent, low mileage, serviced on schedule.
Now count backwards. New vehicle sales in 2022 ran about 3.3 million below the 2019 rate, and far fewer of those sales were leases, because with no inventory a dealer has no reason to offer a lease incentive. Those are the cars that should be coming off lease in the middle of this decade. They do not exist, so the supply of good three-year-old vehicles stayed thin long after the chip shortage was over and the headlines had moved on.
| Period | Millions of vehicles |
|---|---|
| 2017 | 17.6 |
| 2018 | 17.7 |
| 2019 | 17.5 |
| 2020 | 14.9 |
| 2021 | 15.4 |
| 2022 | 14.2 |
| 2023 | 16.0 |
| 2024 | 16.3 |
| 2025 | 16.7 |
| 2026 | 16.5 |
Annual averages of the monthly seasonally adjusted annual rate. 2026 covers January to August. The low point is 2022, two years after the pandemic began.
New vehicle sales did recover, reaching 16.7 million in 2025. But look at where new vehicle prices settled in the first chart. They went up through the shortage and then stayed up. The used spike substantially unwound; the new car price level did not unwind at all. A shock to supply can reset a price permanently even after the shock itself is gone, because the sticker price the whole industry got used to charging is now the sticker price.
What is still argued about
Two things in this episode are genuinely unsettled, and anyone who tells you otherwise is compressing an argument.
The first is the split between supply and demand. Household finances in 2020 and 2021 were unusual: stimulus payments, suspended student loan bills, and very little to spend money on. Some of that money went into vehicles. Economists have spent years trying to divide the price move into a supply part and a demand part, and the estimates differ because the two effects hit the same months.
The second is measurement. The official index does not simply average sticker prices. It tracks a matched set of vehicles and adjusts for quality changes, which is the right method and also a hard one. The Bureau of Labor Statistics publishes how it measures used vehicle prices, and it had to revisit its own seasonal adjustment because 2020 broke the historical patterns the adjustment relies on. The direction and rough size of the move are not in doubt. The second decimal place is.
How to use this the next time something is short
This episode is worth keeping as a template, because shortages keep happening and the coverage of them is usually bad.
Ask how quickly supply can respond. That single question separates a price story that lasts a quarter from one that lasts four years.
Ask what the substitute is, and whether the substitute's supply can respond either. Cars had one, and it could not, which is the whole reason the used market absorbed the shock.
Ask whether you are looking at a rate of change or a level. "Used car prices are falling" and "used car prices are far above 2019" were both true for most of 2023, and the difference between the two sentences is the difference between a headline and an understanding.
Inside Euphoria you can run this experiment yourself: hold supply fixed, push demand up, and watch the price do all the adjusting, which is a thing you feel much more clearly when you are the one moving the slider.
Sources
- FRED, consumer price index for used cars and trucks, from the Bureau of Labor Statistics
- FRED, consumer price index for new vehicles, from the Bureau of Labor Statistics
- FRED, total vehicle sales, from the Bureau of Economic Analysis
- Bureau of Labor Statistics, how the consumer price index measures used car and truck prices
- Cox Automotive, the Manheim used vehicle value index at its December 2021 record of 236.2
- Bureau of Labor Statistics, seasonal adjustment of the used vehicle index after 2020