Investing
How to Read a Stock Quote
The last price is the one number on a quote you cannot trade on. A field by field walk through bid, ask, volume, market cap, both P/E ratios, and stale data.
By the Euphoria team · 2026-07-30 · 8 min read
Key points
- The last price on a quote is a record of a completed trade, not a price you can transact at; the bid and the ask are.
- A two cent spread on a $50 stock costs $40 on a 2,000 share round trip, and that cost never appears on any statement.
- Trailing and forward price to earnings can print 20 and 15 on the same unchanged $60 share price, because only the denominator changed.
- A brokerage must show a real-time consolidated quote where you place an order, but a free quote elsewhere is often fifteen minutes behind.
The one number on the screen that is not a price
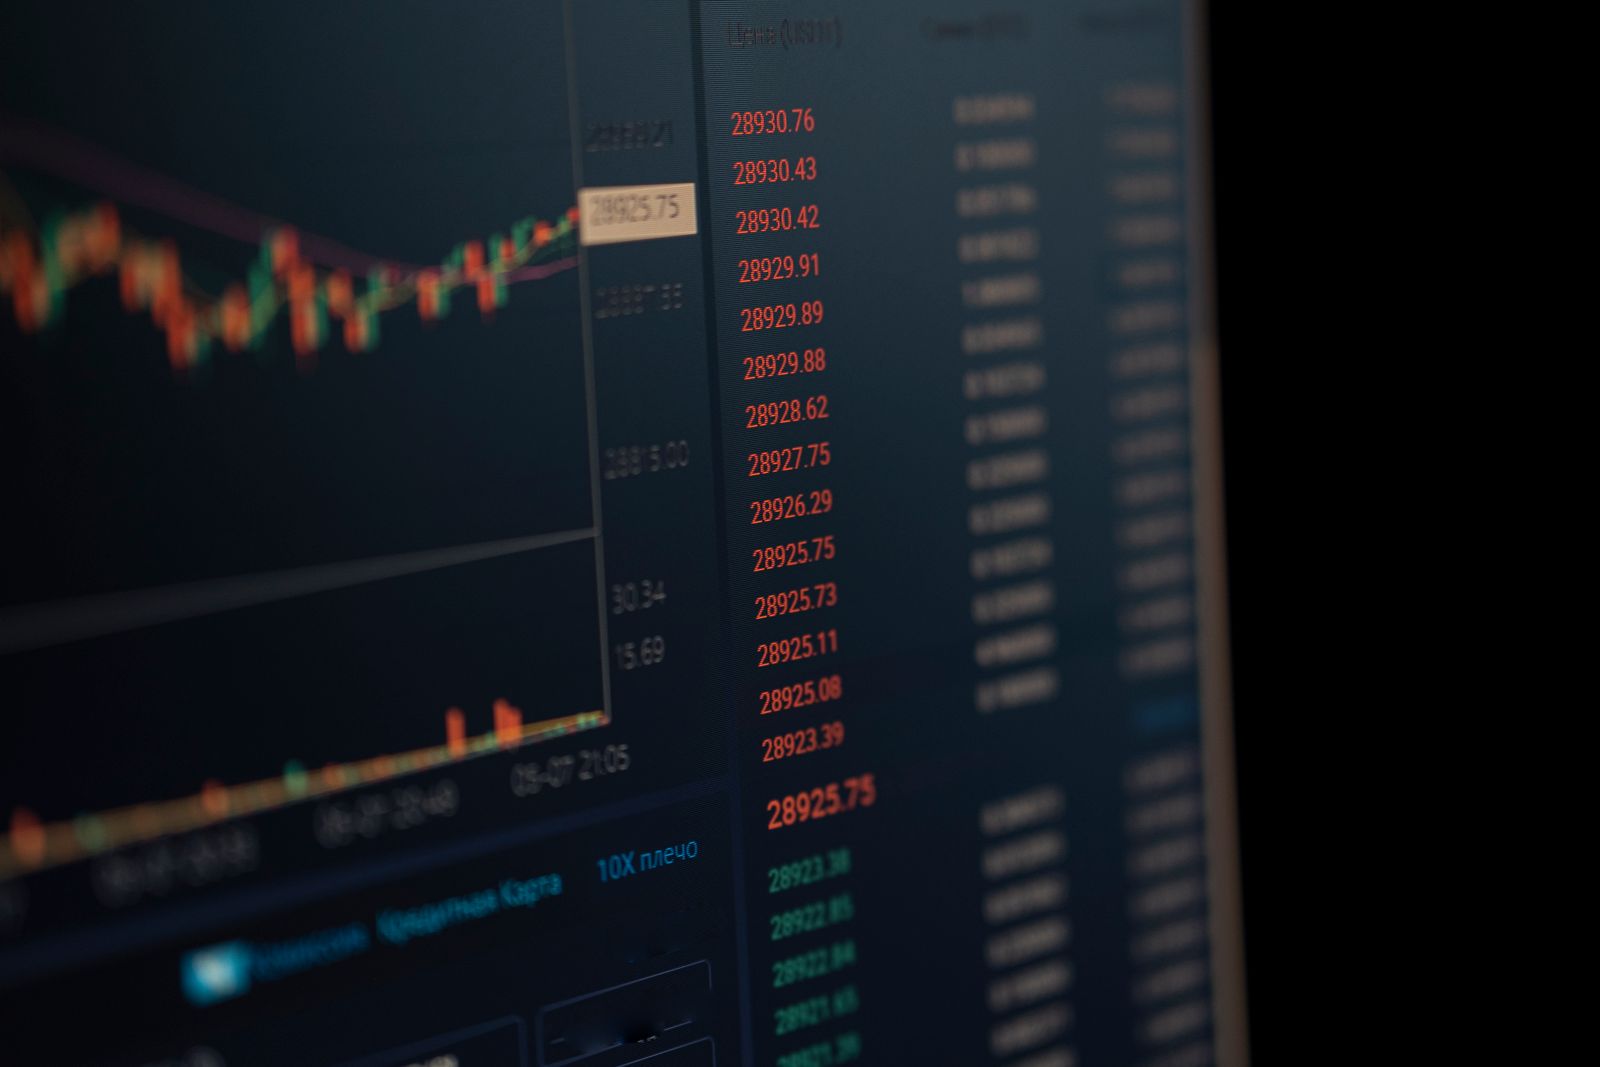
Pull up a quote for any listed company and the biggest number on the page is the last price. It is the figure the app animates in green or red, the one people mean when they ask what a stock is at.
It is also the only number in the whole display that you cannot trade on.
The last price is a record. It says that at some moment in the past, a buyer and a seller agreed on that figure for some quantity of shares, and the trade printed. That moment might have been a tenth of a second ago or, in a thinly traded name, twenty minutes ago. Either way it is history. What you can actually do right now sits two lines below it, in smaller type.
A stock quote looks like one fact with decorations. It is closer to nine separate ideas, each wearing a number, and several of them answer questions you did not ask.
- $0.02 the spread on a stock quoted 49.99 bid against 50.01 ask
- $40 what that spread costs on a 2,000 share round trip
- 15 min the conventional delay on free quote data outside a trading screen
Bid, ask, and the cost that never reaches your statement
Two fields on the quote describe prices you can actually get.
The bid is the highest price someone is currently willing to pay for the stock. The ask, sometimes printed as the offer, is the lowest price at which someone is currently willing to sell. Place a market order to buy and you pay the ask. Sell and you receive the bid.
The gap between them is the bid-ask spread, and it is the most consequential number on the screen that nobody talks about. Suppose a stock is quoted 49.99 bid and 50.01 ask. The spread is two cents. Buy 2,000 shares and you pay $100,020. Sell them back one second later, with no news and no price movement at all, and you receive $99,980. You are down $40 for having done nothing.
That $40 does not appear on your trade confirmation. It is not a commission, it is not a fee, and no line item anywhere will name it. It is the difference between two prices that were both true at the same instant.
| Period | Cost of buying and selling once |
|---|---|
| 2 cent spread | $40 |
| 5 cent spread | $100 |
| 25 cent spread | $500 |
| 50 cent spread | $1,000 |
Buying at the ask and selling at the bid with no price movement in between. The arithmetic is the source: 2,000 shares times the spread. None of it appears on a trade confirmation.
Two cents on a $50 stock is narrow. Plenty of listed stocks trade with spreads of a dime or more, and the same round trip then costs hundreds of dollars.
Volume, and why a quiet stock is more expensive to own
Volume is the number of shares that changed hands, usually for the day so far, sometimes as an average over a recent stretch. On its own it sounds like a popularity statistic. It is closer to a cost forecast.
Here is the mechanism. The spread exists because someone is standing between buyers and sellers, quoting both sides and carrying inventory. That is a risky job. If you buy shares at the bid and the price falls before you find a buyer, you eat the difference, and the wider you quote, the more you are paid for taking that risk.
In a stock where millions of shares trade every day, the risk is small, because a position can be unloaded almost immediately. Competition among market makers then grinds the spread down to a penny or two. In a stock that trades forty thousand shares a day, the same position might take hours to exit, and the quote widens to compensate.
Low volume and a wide spread are therefore not two separate observations about a stock. They are one observation stated twice.
The last price tells you what somebody else paid. The bid and the ask tell you what you would pay.
Day range, 52 week range, open, and previous close
Four fields describe where the price has been, and they are slipperier than they look.
The day range is the low and high printed so far today. The 52 week range is the low and high over the past year. Both are useful as context and dangerous as anchors, because a price sitting near the bottom of its 52 week range tells you where the stock has been and nothing whatsoever about where it is going.
Open is the price of the first trade of the session. Previous close is the last price of the session before. On a quiet day the two are nearly identical. After real news they are not, and the gap between them is one of the more informative things on the whole quote, because it shows a price change that happened while the market was shut and no ordinary investor could act on it. An earnings release at 4:15 in the afternoon gets absorbed overnight, and the opening price simply arrives somewhere else.
This is also why the percentage change on a quote is ambiguous. Most screens compute it from the previous close, so on a gap day the figure you are reading may already exclude the move that mattered.
Market cap is the price of the company, not the price of the share
Market capitalization is the share price multiplied by the number of shares outstanding. The SEC glossary puts it in those exact terms, as the market price of one share times the total shares outstanding.
It earns its place on a quote because the share price alone carries no information about size. A $12 stock and a $900 stock tell you nothing about which company is bigger, since a company chooses how many slices to cut its pie into. Two businesses of identical value can quote at $12 and $900 purely because one issued seventy-five times as many shares.
Market cap strips that arbitrariness out. It is the only field on the screen that answers the question most people think the share price answers.
Two P/E ratios that answer two different questions
The price to earnings ratio divides the share price by earnings per share. Investor.gov describes it as a way of gauging whether the stock price is high or low compared to the past or to other companies.
The detail that gets lost is which earnings. A trailing multiple uses the earnings the company actually reported over the past twelve months. A forward multiple uses the earnings analysts expect over the next twelve. These are not two measurements of one thing. One is arithmetic on an audited number, the other is arithmetic on a forecast.
Watch what that does to a single unchanged share price of $60.
| Period | Price to earnings multiple |
|---|---|
| Trailing, $3.00 reported | 20 |
| Forward, $4.00 expected | 15 |
| Forward, $2.40 expected | 25 |
The share price is $60 in all three bars. Only the earnings figure in the denominator changed, which is why a bare multiple with no label tells you very little.
The price never moved. Only the denominator changed, and the multiple went from 20 to 15 to 25. A quote that prints a bare "P/E 15" without saying trailing or forward has handed you an answer and withheld the question. For a company whose profits are growing quickly the two figures sit a long way apart, and which one a headline picks is often the entire argument.
Dividend yield and beta both move when you are not looking
Dividend yield is the annual dividend per share divided by the current share price. Because the price is in the denominator, the yield rises when the price falls, with no action from the company at all. A yield that has climbed sharply usually means the share price dropped rather than that the payout grew, and both stories produce the same number.
Beta measures how much a stock has moved historically relative to the broad market. A beta of 1 means it has tended to move in step, 1.5 means it has tended to move half again as far in either direction, 0.6 means less. Two things about it are worth holding onto. It is backward looking, computed from a past window, and the length of that window is a choice the data provider made rather than a property of the stock. And it measures amplitude, not direction.
Why your quote might be fifteen minutes old
Here is a piece of market plumbing almost nobody is told about.
Every exchange reports its trades and quotes into a central system, which combines them and publishes a single national best bid and offer across all venues. When you look at a quote inside a brokerage app at the point of placing an order, you are entitled to that consolidated real-time view. FINRA guidance on the vendor display rule is blunt about it: firms must show the consolidated national best bid and offer, with prices, sizes and market identification, wherever a customer may make a trading decision, and examiners have flagged firms for substituting fifteen minute delayed data in those places.
Outside that setting, delay is normal. A free quote on a media site or a search page is often running fifteen minutes behind, which is exactly enough to be useless in a fast market and perfectly adequate for reading the news.
The consolidated feed is not the fastest data in existence either. The SEC said as much when it adopted rules to modernize equity market data infrastructure in December 2020, noting that the content and latency differences between the consolidated feed and the exchanges own proprietary products had become increasingly important. That framework, built around competing consolidators instead of a single processor, is still being put in place, so how much of the gap eventually closes is an open question rather than a finished story.
Reading the next quote you see
Three habits turn a quote from a number into information.
Separate the fields that are measurements from the fields that are arithmetic on a measurement. Last price, volume, open and the two ranges are things that happened. Market cap, price to earnings, yield and beta are all computed on top of a price, which means every one of them moves when the price moves, even when nothing about the company changed.
Look at the spread before you look at the price. It is the only field that tells you what the trade will cost you beyond the price itself.
Ask what the denominator is. Forward or trailing earnings, which dividend, which window for beta. Each of those choices belongs to whoever built the screen, and none of them are printed on it.
On Euphoria a quote is something you take apart rather than stare at. Paper trading puts a live spread in front of you and lets it cost you money on a round trip, which is a lesson that lands in about four seconds and never quite leaves.
Sources
- Investor.gov, How Stock Markets Work
- Investor.gov glossary, Market Capitalization
- Investor.gov glossary, Price-earnings (P/E) Ratio
- FINRA, Vendor Display Rule, on the consolidated display of the national best bid and offer
- SEC, rules to modernize the infrastructure that collects and disseminates equity market data, December 2020